- Home
- Views On News
- Feb 13, 2023 - Crucial Week for Nifty Pharma Stocks. Will the Bulls Break Through?
Crucial Week for Nifty Pharma Stocks. Will the Bulls Break Through?

The golden period of the pandemic rally ended in July 2021 for the Nifty pharma index with the index topping at 14,700.
Though the index managed to hit a new high of 14,900 in October 2021, the lack of breadth resulted in a fall of over 20%.
You might have experienced waiting outside the operation theatre and watching the red light to switch off when your dear ones are being operated.
The technical chart of the Nifty Pharma index is trading at crucial life-saving levels and seems to be waiting outside the operation theatre.
Can the bulls provide the shot in the arm?
Before I head to the chart of the Nifty Pharma index, let's analyze the chart of the US Nasdaq Smart Pharmaceuticals Index.
The NASDAQ Smart Pharmaceuticals Index is a benchmark for investors who are interested in investing in the pharma sector.
It includes companies that are involved in the research, development, manufacturing, and marketing of pharmaceutical products, including prescription drugs, over-the-counter medications, and other health-related products.
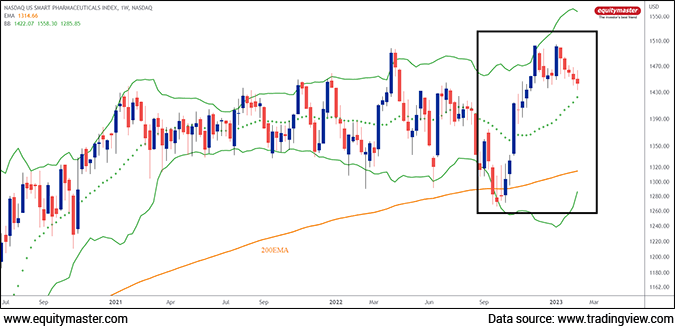
Nasdaq Smart Pharmaceuticals Index - Weekly Chart

Nasdaq Smart Pharmaceuticals Index (NQSSPH) witnessed a brisk rally of ~18% in the span of 9 weeks (September 2022 to November 2022) after testing the long-term moving average of 200 weeks.
The 200WEMA (Weekly Exponential Moving Average) coupled with the Bollinger Bands (BB) is an excellent combo to confirm the support levels.
The 20DMA with a 2% standard deviation, the default of Bollinger Bands signals the support and resistance zone on the charts.
Bulls grabbed the opportunity at the lower band of BB and 200WEMA taking the index from US$1,266 to US$1,502.
As Indian share markets are followers of US markets, the rally in US pharma stocks may trigger a bullish scenario on the Indian pharma index.
What do the charts suggest for Nifty Pharma Index?
As we highlighted the chart pattern on the US pharma index, the same indicators are applied to the Indian pharma index too.
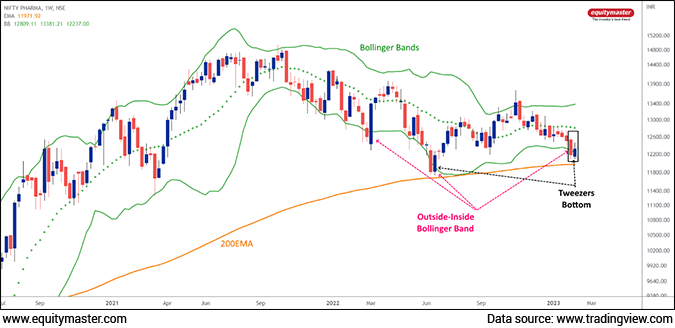
Nifty Pharma Index - Weekly Chart

The index is trading at the 200WEMA and lower bands of Bollinger Bands on the weekly chart of the Nifty Pharma Index.
Technically, we are witnessing multiple reversal patterns on the above chart.
- Tweezers Bottom - It is a two-candlestick pattern bullish reversal pattern that indicates a potential trend reversal from a downward trend to an upward trend. At the consecutive low of 12,086, the tweezer's bottom pattern is visible on the weekly chart.
- Outside-Inside Bollinger Band pattern - It refers to a situation in which a stock price moves outside of the lower Bollinger Bands, which are a set of lines plotted two standard deviations away from a moving average, and then moves back inside. Last week positive candle closed above the lower band of BB confirming the outside-inside Bollinger band pattern.
If you look at the Nifty Pharma chart, the historical performance of the above-mentioned pattern is highlighted which multiplies the conviction of reversal on cards.
Rewinding five months of the US Pharmaceuticals Index chart, the lows of September 2022 were near the 200WEMA and lower BB.
Coming to the present, the lows of the Nifty Pharma index are near the 200WEMA and lower BB.
As a follower, I am expecting the Nifty Pharma index to follow the US Pharma index this time and the reversal cannot be ruled out.
The failure of the chart pattern on the Nifty Pharma index will be below 12,000. While the reversal can take index towards the upper band at 13,300+ levels.
What are your thoughts on the pharma sector in 2023? Do share your views in the comments section below.
I'll share more on his trend on my Telegram group. If you're interested in being part of my charting journey as I share how to create wealth from profitable trade setups, join my telegram channel - Fast Profits Daily.
Safe Stocks to Ride India's Lithium Megatrend
Lithium is the new oil. It is the key component of electric batteries.
There is a huge demand for electric batteries coming from the EV industry, large data centres, telecom companies, railways, power grid companies, and many other places.
So, in the coming years and decades, we could possibly see a sharp rally in the stocks of electric battery making companies.
If you're an investor, then you simply cannot ignore this opportunity.
Details of our SEBI Research Analyst registration are mentioned on our website - www.equitymaster.comDisclaimer: This article is for information purposes only. It is not a stock recommendation and should not be treated as such. Learn more about our recommendation services here...

Brijesh Bhatia Research Analyst and expert chartist, is the editor of Alpha Wave Profits. Fully committed to his craft, Brijesh has mastered the art of making money by trading using technical analysis. Brijesh has an MBA from ICFAI and 16 years of experience in India's financial markets. He began his career on Dalal Street as commodities dealer and it wasn't long before he developed his own unique trading system. Brijesh worked on his trading system until it could be expected to deliver 5 units of return for every unit of risk.


Equitymaster requests your view! Post a comment on "Crucial Week for Nifty Pharma Stocks. Will the Bulls Break Through?". Click here!
Comments are moderated by Equitymaster, in accordance with the Terms of Use, and may not appear
on this article until they have been reviewed and deemed appropriate for posting.
In the meantime, you may want to share this article with your friends!